pacman::p_load(
  tidyverse,
  kableExtra,
  latex2exp
)3 Risk sharing with limited commitoment: model
Here I demonstrate how to compute value functions and consumption under risk-sharing with limited commitment. First I show the risk-sharing model with limited commitment, and then I show the calculation of value functions.
3.1 Model
I consider constrained-efficient consumption allocations. The social planner solves the following problem:
\begin{align*} &\max_{\{c_{it}(s^t)\}} \sum_i \lambda_i \sum_{t = 1}^{\infty} \sum_{s^t} \delta^t \pi(s^t) u(c_{it}(s^t)) \\ \text{subject to} &\sum_i c_{it} (s^t) \le \sum_i y_{it}(s_t) \quad \forall s^t, \forall t \\ &\sum_{r = t}^{\infty} \sum_{s^r} \delta^{r - t} \pi(s^r | s^t) u(c_{ir}(s^r)) \ge U_{i}^{aut}(s_t) \quad \forall s^t, \forall t, \forall i. \end{align*}Here, the income follows a Markov process and is independent across households. Notice the difference between the history of states up to period t (s^t) and the state at period t (s_t). The variable \lambda_i is the Pareto weight of a household i. The last equation is the participation constraints (PCs), whose RHS is the value of autarky and the solution of the following Bellman equation:
U_i^{aut}(s_t) = u((1 - \phi) y_{it}(s_t)) + \delta \sum_{s^{t + 1}} \pi(s_{t + 1} | s_t) U_{i}^{aut}(s_{t + 1}), where \phi is the punishment of renege, which is a fraction of consumption each period. It is assumed that savings are absent.
Letting the multiplier on the PC of i be \delta^t \pi(s^t) \mu_i(s^t) and the multiplier on the aggregate resource constraint be \delta^t \pi(s^t) \rho(s^t), the Lagrangian is
\sum_{t = 1}^{\infty} \sum_{s^t} \delta^t \pi(s^t) \left\{ \sum_i \left[ \lambda_i u(c_{it}(s^t)) + \mu_i(s^t) \left( \sum_{r = t}^{\infty} \sum_{s^r} \delta^{r - t} \pi(s^r | s^t) u (c_{ir} (s^r)) - U_i^{aut}(s_t) \right) \right] + \rho(s^t) \left( \sum_i \left(y_{it} (s_t) - c_{it} (s^t) \right) \right) \right\} With the recursive method in Marcet and Marimon (2019), this Lagrangian can be written as
\sum_{t = 1}^{\infty} \sum_{s^t} \delta^t \pi(s^t) \left\{ \sum_i \left[ M_i (s^{t - 1}) u (c_{it} (s^t)) + \mu_i (s^t) (u (c_{it} (s^t)) - U_i^{aut} (s_t)) \right] + \rho(s^t) \left( \sum_i \left( y_{it}(s_t) - c_{it} (s^t) \right) \right) \right\},
where M_i(s^t) = M_i(s^{t - 1}) + \mu_i(s^t) and M_i(s^0) = \lambda. The variable M_i(s^t) is the current Pareto weight of household i and is equal to its initial Pareto weight plus the sum of the Lagrange mulipliers on its PCs along the history s^t.
From the Lagrangian, the optimality condition is u'(c_{it}(s^t)) M_i(s^t) = \frac{\rho(s^t)}{\delta^t \pi(s^t)}, and thus, for two households i and j (i \ne j), u'(c_{it}(s^t)) M_i(s^t) = u'(c_{jt}(s^t)) M_j(s^t). Taking logarithms and summing over households j \ne i, I get \begin{aligned} \log \left(u'(c_{it}(s^t)) \right) + \log \left(M_i(s^t) \right) = \frac{1}{N - 1} \sum_{j \ne i} \log \left(u'(c_{jt}(s^t)) \right) + \frac{1}{N - 1} \sum_{j \ne i} \log \left(M_j(s^t) \right). \end{aligned}
The pareto weights of N-households are intractable and the dimension of the value function becomes too large. Hence, I take the “one-versus-the-rest” approach. In particular, assume that “the rest of the village” has the same consumption (c_{vt}(s^t)) and Pareto weights (M_v(s^t)). Then the equation above becomes
\begin{aligned} \log \left(u'('c_{it}(s^t)) \right) + \log \left(M_i(s^t) \right) &= \log \left(u'(c_{vt}(s^t)) \right) + \log \left( M_v(s^t) \right) \\ \Leftrightarrow \frac{u'(c_{vt}(s^t))}{u'(c_{it}(s^t))} = \frac{M_i(s^t)}{M_v(s^t)} \end{aligned} Note that this is equivalent to the optimality condition that the ratio of marginal utilities between two “households”, i and v, equals the ratio of their Pareto weights.
Let x_i(s^t) = \frac{M_i(s^t)}{M_v(s^t)}, the relative Pareto weight of household i under the history s^t. Then, the vector of relative weights x(s^t) plays as a role as a co-state variable, and the solution consists of policy functions x_{it}(s_t, x_{t - 1}) and c_{it}(s_t, x_{t - 1}). That is, x_{t - 1} is a sufficient statistic for the history up to t - 1. The optimality condition is
\frac{u'(c_{vt}(s_t, x_{t - 1}))}{u'(c_{it}(s_t, x_{t - 1}))} = x_{it}(s_t, x_{t - 1}) \quad \forall i.
Using the policy functions, the individual value functioon can be written recursively as
V_i(s_t, x_{t - 1}) = u (c_{it} (s_t, x_{t - 1})) + \delta \sum_{s_{t + 1}} \pi(s_{t + 1} | s_t) V_i (s_{t + 1}, x_t(s_t, x_{t - 1})).
The evolution of relative Pareto weights is fully characterized by state-dependent intervals, which give the weights in the case where PCs are binding (Ligon, Thomas, and Worrall (2002)).
3.2 Code
3.2.1 Utility functions
calculateUtility <- function(cons, sigma) {
  if (sigma != 1) {
    utility = (cons^(1 - sigma) - 1) / (1 - sigma)
  } else if (sigma == 1) {
    utility = log(cons)
  }
  return(utility)
}
calculateMarginalUtility <- function(cons, sigma) cons^(- sigma)
3.2.2 Value under autarky
calculateAutarkyValue <- function(
    incomeGridPoints,
    sigma,
    delta,
    punishment,
    incomeTransitionMatrix
) {

  autarkyValue <- numeric(length = length(incomeGridPoints))
  i <- 1
  diff <- 1
  while (diff > 1e-12) {
    autarkyValueNew <- (
      calculateUtility(incomeGridPoints * (1 - punishment), sigma)
      + delta * incomeTransitionMatrix %*% autarkyValue
    )
    diff <- max(abs(autarkyValueNew - autarkyValue))
    autarkyValue <- autarkyValueNew
    i <- i + 1
  }
  return(autarkyValue)
}
3.2.3 Create grid of relative Pareto weights
Here, I make the grid of relative Pareto weight of the household, x(s^t), on which I compute the values (I use the notation x(s^t) rather than x_i(s^t) since there are only two households).
getRelativeParetoWeightsGridPoints <- function(
    sigma,
    punishment,
    householdIncomeGridPoints,
    villageIncomeGridPoints,
    numRelativeParetoWeights
    ) {

  minRelativeParetoWeights <- (
    calculateMarginalUtility(max(villageIncomeGridPoints), sigma)
    / calculateMarginalUtility(min(householdIncomeGridPoints * (1 - punishment)), sigma)
  )
  maxRelativeParetoWeights <- (
    calculateMarginalUtility(min(villageIncomeGridPoints * (1 - punishment)), sigma)
    / calculateMarginalUtility(max(householdIncomeGridPoints), sigma)
  )
  relativeParetoWeightsGridPoints <- exp(
    seq(
      log(minRelativeParetoWeights),
      log(maxRelativeParetoWeights),
      length.out = numRelativeParetoWeights)
    )
  return(relativeParetoWeightsGridPoints)
}
3.2.4 Calculate consumption on the grid points
Then, I compute consumptions of the household on these grid points. From the optimality condition and the CRRA utility functions, we obtain
\begin{aligned} \frac{c_{vt}^{-\sigma}}{c_{it}^{-\sigma}} &= x_{t} \\ \Leftrightarrow c_{vt} &= c_{it} x_t^{-1/\sigma} \\ \Leftrightarrow (N - 1) c_{vt} &= (N - 1) c_{it} x_t^{-1/\sigma} \\ \Leftrightarrow c_{it} + (N - 1) c_{vt} &= c_{it} \left( 1 + (N - 1) x_t^{-1/\sigma} \right) \\ \Leftrightarrow c_{it} &= \frac{y_t}{ \left( 1 + (N - 1) x_t^{-1/\sigma} \right)}, \end{aligned} where y_t is the village aggregate income and the last transformation used the village wide equals the aggregate income due to the no saving assumption.
calculateHouseholdConsumption <- function(
  aggregateIncome,
  relativeParetoWeight,
  numHouseholds,
  sigma
) {
    aggregateIncome / (1 + (numHouseholds - 1) * (relativeParetoWeight^(- 1 / sigma)))
}
3.2.5 Caclulate values under full risk-sharing
Now, I compute the values under full risk-sharing, which will be used as the initial values in value function iterations under the limited commitment model. Note that, under full risk sharing, the consumption only depends on the aggregate resources and time-invariate relative Pareto weights. Hence, I numerically solve the following Bellman equation:
V_i^{full}(s_t, x) = u(c_{it}(s_t, x)) + \delta \sum_{s^{t + 1}} \pi(s_{t + 1} | s_t) V_{i}^{full}(s_{t + 1}, x).
calculateValueFullRiskSharing <- function(
  incomeTransitionMatrix,
  aggregateIncomeGridPoints,
  delta,
  sigma,
  autarkyValueMatrix,
  consumptionOnRelativeParetoWeightGrid,
  numRelativeParetoWeights,
  numHouseholds
  ) {

  # Initial guess is expected utilities under autarky
  householdValueFullRiskSharing <- outer(
    autarkyValueMatrix[, 1], rep(1, numRelativeParetoWeights)
    )
  villageValueFullRiskSharing <- outer(
    autarkyValueMatrix[, 2], rep(1, numRelativeParetoWeights)
    )

  iteration <- 1
  diff <- 1
  while (diff > 1e-10 & iteration < 500) {
    householdValueFullRiskSharingNew <- (
      calculateUtility(consumptionOnRelativeParetoWeightGrid, sigma)
      + delta * incomeTransitionMatrix %*% householdValueFullRiskSharing
    )
    villageValueFullRiskSharingNew <- (
      calculateUtility(
        (aggregateIncomeGridPoints - consumptionOnRelativeParetoWeightGrid) / (numHouseholds - 1),
        sigma
        )
      + delta * incomeTransitionMatrix %*% villageValueFullRiskSharing
    )

    diff <- max(
      max(abs(householdValueFullRiskSharing - householdValueFullRiskSharingNew)),
      max(abs(villageValueFullRiskSharing - villageValueFullRiskSharingNew))
      )
    householdValueFullRiskSharing <- householdValueFullRiskSharingNew
    villageValueFullRiskSharing <- villageValueFullRiskSharingNew
    iteration <- iteration + 1

  }

  return(list(
    householdValueFullRiskSharing = householdValueFullRiskSharing,
    villageValueFullRiskSharing = villageValueFullRiskSharing
    ))
}
3.2.6 Calculate values under risk-sharing with limited commitment
Next, I calculate the values under limited commitment, and then derive the state-dependent intervals of relative Pareto weights. For the values, in the h’th iteration, I calculate them as if no participation constraints are binding: \tilde{V}_i^h(s, x) = u(c_i(s, x)) + \delta \sum_{s'} \pi(s' | s) V_i^{h-1}(s', x). Note that the current relative Pareto weight (the second argument in V_i^{h - 1}) is still x due to not binding participation contraints.
Then, I consider the following cases:
- If \tilde{V}_1^h(s, x) \ge U_1^{aut}(s) and \tilde{V}_2^h(s, x) \ge U_2^{aut}(s), this means that the participation contraints are not binding. Therefore, I update the values as V_1^h(s, x) = \tilde{V}_1^h(s, x) and V_2^h(s, x) = \tilde{V}_2^h(s, x).
- If \tilde{V}_1^h(s, x) < U_1^{aut}(s), then the household 1’s participation constraint is binding. Hence, V_1^h(s, x) = U_1^{aut}(s).
- If \tilde{V}_2^h(s, x) < U_2^{aut}(s), then the household 2’s participation constraint is binding. Hence, V_2^h(s, x) = U_2^{aut}(s).
- For V_2^h(s, x) in the second case, I get the maximum x so that V_1^h(s, x) = U_1^{aut}(s) (which is presumably \underline{x} in this iteration) and, lettting this x be x_{max}, use V_2^{h - 1}(s, x_{max}) as V_2^h(s, x). Similarly, for V_1^h(s, x) in the third case, I get the minimum x so that V_2^h(s, x) = U_2^{aut}(s) (which is presumably \overline{x} in this iteration) and, lettting this x be x_{min}, use V_1^{h - 1}(s, x_{min}) as V_1^h(s, x).
Repeat this until V_1(s, x) and V_2(s, x) converge. After this, I derive the state-dependent intervals of relative Pareto weights.
Note that the bounds satisfy u(c_1(\underline{x}(s))) + \delta \sum_{s'} \pi(s' | s) V_1(s', \underline{x}(s)) = U_1^{aut}(s) and u(c_2(\overline{x}(s))) + \delta \sum_{s'} \pi(s' | s) V_2(s', \overline{x}(s)) = U_2^{aut}(s), where u(c_1(\underline{x}(s))) and c_2(\overline{x}(s) are determined from the optimality conditions \frac{u'(c_v(\underline{x}(s)))}{u'(c_i(\underline{x}(s)))} = \underline{x}(s) and \frac{u'(c_v(\overline{x}(s)))}{u'(c_i(\overline{x}(s)))} = \overline{x}(s). I numerically solve them to obtain the bounds.
interpolateValueFunction <- function(
    relativeParetoWeight,
    relativeParetoWeightsGridPoints,
    valueFunctionMatrix
    ) {
  apply(
    valueFunctionMatrix,
    1,
    function(x) {
      approx(
        relativeParetoWeightsGridPoints,
        x,
        relativeParetoWeight,
        rule = 2
        )$y
    }
    )
}

calculateDiffLCRiskSharingAndAutarky <- function(
    relativeParetoWeight,
    relativeParetoWeightsGridPoints,
    delta,
    sigma,
    aggregateIncome,
    householdValueLCRiskSharing,
    villageValueLCRiskSharing,
    incomeTransitionProbVec,
    householdAutarkyValue,
    villageAutarkyValue,
    numHouseholds
    ) {

  householdConsumption <- calculateHouseholdConsumption(
    aggregateIncome,
    relativeParetoWeight,
    numHouseholds,
    sigma
  )

  householdValueLCRiskSharingAtRelativeParetoWeight <- interpolateValueFunction(
    relativeParetoWeight,
    relativeParetoWeightsGridPoints,
    householdValueLCRiskSharing
    )
  villageValueLCRiskSharingAtRelativeParetoWeight <- interpolateValueFunction(
    relativeParetoWeight,
    relativeParetoWeightsGridPoints,
    villageValueLCRiskSharing
    )

  householdDiffLCRiskSharingAndAutarky <- (
    calculateUtility(householdConsumption, sigma)
    + delta * incomeTransitionProbVec %*% householdValueLCRiskSharingAtRelativeParetoWeight
    - householdAutarkyValue
  ) %>% as.numeric
  villageDiffLCRiskSharingAndAutarky <- (
    calculateUtility((aggregateIncome - householdConsumption) / (numHouseholds - 1), sigma)
    + delta * incomeTransitionProbVec %*% villageValueLCRiskSharingAtRelativeParetoWeight
    - villageAutarkyValue
  ) %>% as.numeric

  return(list(
    householdDiffLCRiskSharingAndAutarky = householdDiffLCRiskSharingAndAutarky,
    villageDiffLCRiskSharingAndAutarky = villageDiffLCRiskSharingAndAutarky
  ))
}


calculateValueLCRiskSharing <- function(
  valueFullRiskSharing,
  consumptionOnRelativeParetoWeightGrid,
  aggregateIncomeGridPoints,
  incomeTransitionMatrix,
  autarkyValueMatrix,
  relativeParetoWeightsGridPoints,
  numRelativeParetoWeights,
  delta,
  sigma,
  numIncomeStates,
  numHouseholds,
  iterationLimit,
  diffLimit
) {

  # Initial guess is expected utilities under full risk sharing
  householdValueLCRiskSharing <- valueFullRiskSharing$householdValueFullRiskSharing
  villageValueLCRiskSharing <- valueFullRiskSharing$villageValueFullRiskSharing

  diff <- 1
  iteration <- 1
  while ((diff > diffLimit) && (iteration <= iterationLimit)) {

    # First, ignore enforceability and just update the value functions
    # using the values at the previous iteration
    householdValueLCRiskSharingNew <- (
      calculateUtility(consumptionOnRelativeParetoWeightGrid, sigma)
      + delta * incomeTransitionMatrix %*% householdValueLCRiskSharing
    )
    villageValueLCRiskSharingNew <- (
      calculateUtility(
        (aggregateIncomeGridPoints - consumptionOnRelativeParetoWeightGrid) / (numHouseholds - 1),
        sigma
        )
      + delta * incomeTransitionMatrix %*% villageValueLCRiskSharing
    )

    # Now check enforceability at each state
    for (incomeStateIndex in seq(1, numIncomeStates)) {
      householdAutarkyValue <- autarkyValueMatrix[incomeStateIndex, 1]
      villageAutarkyValue <- autarkyValueMatrix[incomeStateIndex, 2]

      if (any(householdValueLCRiskSharingNew[incomeStateIndex, ] <= householdAutarkyValue)) {
        villageValueLCRiskSharingNew[
          incomeStateIndex,
          householdValueLCRiskSharingNew[incomeStateIndex, ] <= householdAutarkyValue
        ] <- villageValueLCRiskSharingNew[
          incomeStateIndex,
          householdValueLCRiskSharingNew[incomeStateIndex, ] <= householdAutarkyValue
        ] %>% min
        householdValueLCRiskSharingNew[
          incomeStateIndex,
          householdValueLCRiskSharingNew[incomeStateIndex, ] <= householdAutarkyValue
        ] <- householdAutarkyValue
      }

      if (any(villageValueLCRiskSharingNew[incomeStateIndex, ] <= villageAutarkyValue)) {
        householdValueLCRiskSharingNew[
          incomeStateIndex,
          villageValueLCRiskSharingNew[incomeStateIndex, ] <= villageAutarkyValue
        ] <- householdValueLCRiskSharingNew[
          incomeStateIndex,
          villageValueLCRiskSharingNew[incomeStateIndex, ] <= villageAutarkyValue
        ] %>% min
        villageValueLCRiskSharingNew[
          incomeStateIndex,
          villageValueLCRiskSharingNew[incomeStateIndex, ] <= villageAutarkyValue
        ] <- villageAutarkyValue
      }
    }

    diff <- max(
      max(abs(householdValueLCRiskSharingNew - householdValueLCRiskSharing)),
      max(abs(villageValueLCRiskSharingNew - villageValueLCRiskSharing))
    )
    householdValueLCRiskSharing <- householdValueLCRiskSharingNew
    villageValueLCRiskSharing <- villageValueLCRiskSharingNew
    iteration <- iteration + 1
  }

  relativeParetoWeightBounds <- matrix(NA, nrow = numIncomeStates, ncol = 2)

  for (incomeStateIndex in seq(1, numIncomeStates)) {
    aggregateIncome <- aggregateIncomeGridPoints[incomeStateIndex]
    incomeTransitionProbVec <- incomeTransitionMatrix[incomeStateIndex,]
    householdAutarkyValue <- autarkyValueMatrix[incomeStateIndex, 1]
    villageAutarkyValue <- autarkyValueMatrix[incomeStateIndex, 2]

    if (
      calculateDiffLCRiskSharingAndAutarky(
        min(relativeParetoWeightsGridPoints),
        relativeParetoWeightsGridPoints,
        delta,
        sigma,
        aggregateIncome,
        householdValueLCRiskSharing,
        villageValueLCRiskSharing,
        incomeTransitionProbVec,
        householdAutarkyValue,
        villageAutarkyValue,
        numHouseholds
        )$householdDiffLCRiskSharingAndAutarky < 0) {
        relativeParetoWeightLowerBound <- uniroot(
          function(x) {calculateDiffLCRiskSharingAndAutarky(
          x,
          relativeParetoWeightsGridPoints,
          delta,
          sigma,
          aggregateIncome,
          householdValueLCRiskSharing,
          villageValueLCRiskSharing,
          incomeTransitionProbVec,
          householdAutarkyValue,
          villageAutarkyValue,
          numHouseholds
          )$householdDiffLCRiskSharingAndAutarky},
        c(min(relativeParetoWeightsGridPoints), max(relativeParetoWeightsGridPoints)),
        tol = 1e-10,
        maxiter = 300
        )$root
        } else {
          relativeParetoWeightLowerBound <- min(relativeParetoWeightsGridPoints)
        }

    if (
      calculateDiffLCRiskSharingAndAutarky(
        max(relativeParetoWeightsGridPoints),
        relativeParetoWeightsGridPoints,
        delta,
        sigma,
        aggregateIncome,
        householdValueLCRiskSharing,
        villageValueLCRiskSharing,
        incomeTransitionProbVec,
        householdAutarkyValue,
        villageAutarkyValue,
        numHouseholds
        )$villageDiffLCRiskSharingAndAutarky < 0) {
        relativeParetoWeightUpperBound <- uniroot(
          function(x) {calculateDiffLCRiskSharingAndAutarky(
          x,
          relativeParetoWeightsGridPoints,
          delta,
          sigma,
          aggregateIncome,
          householdValueLCRiskSharing,
          villageValueLCRiskSharing,
          incomeTransitionProbVec,
          householdAutarkyValue,
          villageAutarkyValue,
          numHouseholds
          )$villageDiffLCRiskSharingAndAutarky},
        c(min(relativeParetoWeightsGridPoints), max(relativeParetoWeightsGridPoints)),
        tol = 1e-10,
        maxiter = 300
        )$root
        } else {
          relativeParetoWeightUpperBound <- max(relativeParetoWeightsGridPoints)
        }
        relativeParetoWeightBounds[incomeStateIndex, 1] <- relativeParetoWeightLowerBound
        relativeParetoWeightBounds[incomeStateIndex, 2] <- relativeParetoWeightUpperBound
        }

  # for (incomeStateIndex in seq(1, numIncomeStates)) {
  #   aggregateIncome <- aggregateIncomeGridPoints[incomeStateIndex]
  #   incomeTransitionProbVec <- incomeTransitionMatrix[incomeStateIndex,]
  #   householdAutarkyValue <- autarkyValueMatrix[incomeStateIndex, 1]
  #   villageAutarkyValue <- autarkyValueMatrix[incomeStateIndex, 2]
  #
  #   if (householdValueLCRiskSharing[incomeStateIndex, 1] <= householdAutarkyValue) {
  #     relativeParetoWeightBounds[incomeStateIndex, 1] <- max(
  #       relativeParetoWeightsGridPoints[
  #         householdValueLCRiskSharing[incomeStateIndex, ] <= householdAutarkyValue
  #       ]
  #     )
  #   } else {
  #     relativeParetoWeightBounds[incomeStateIndex, 1] <- min(relativeParetoWeightsGridPoints)
  #   }
  #
  #   if (villageValueLCRiskSharing[incomeStateIndex, numRelativeParetoWeights] <= villageAutarkyValue) {
  #     relativeParetoWeightBounds[incomeStateIndex, 2] <- min(
  #       relativeParetoWeightsGridPoints[
  #         villageValueLCRiskSharing[incomeStateIndex, ] <= villageAutarkyValue
  #       ]
  #     )
  #   } else {
  #     relativeParetoWeightBounds[incomeStateIndex, 2] <- max(relativeParetoWeightsGridPoints)
  #   }
  # }

  if (iteration == iterationLimit) {
    print("Reached the maximum limit of iterations!")
  }

  return(list(
    householdValueLCRiskSharing = householdValueLCRiskSharing,
    villageValueLCRiskSharing = villageValueLCRiskSharing,
    relativeParetoWeightBounds = relativeParetoWeightBounds))
}
solveLCRiskSharing <- function(
delta,
sigma,
punishment,
householdIncomeTransitionMatrix,
householdIncomeGridPoints,
villageIncomeTransitionMatrix,
villageIncomeGridPoints,
numIncomeStates,
numHouseholds,
numRelativeParetoWeights = 2000,
iterationLimit = 100,
diffLimit = 1e-8
) {
incomeTransitionMatrix <- kronecker(
villageIncomeTransitionMatrix,
householdIncomeTransitionMatrix
)
incomeGridPointsMatrix <- as.matrix(expand.grid(
householdIncomeGridPoints, villageIncomeGridPoints
))
aggregateIncomeGridPoints <- (
incomeGridPointsMatrix[, 1] + incomeGridPointsMatrix[, 2] * (numHouseholds - 1)
)
autarkyValueMatrix <- expand.grid(
calculateAutarkyValue(
householdIncomeGridPoints,
sigma,
delta,
punishment,
householdIncomeTransitionMatrix
),
calculateAutarkyValue(
villageIncomeGridPoints,
sigma,
delta,
punishment,
villageIncomeTransitionMatrix
)
)
relativeParetoWeightsGridPoints <- getRelativeParetoWeightsGridPoints(
sigma,
punishment,
householdIncomeGridPoints,
villageIncomeGridPoints,
numRelativeParetoWeights
)
consumptionOnRelativeParetoWeightGrid <- matrix(
NA, nrow = numIncomeStates, ncol = numRelativeParetoWeights
)
for (incomeStateIndex in seq_along(aggregateIncomeGridPoints)) {
for (relativeParetoWeightIndex in seq_along(relativeParetoWeightsGridPoints)) {
consumptionOnRelativeParetoWeightGrid[
incomeStateIndex,
relativeParetoWeightIndex
] <- calculateHouseholdConsumption(
aggregateIncomeGridPoints[incomeStateIndex],
relativeParetoWeightsGridPoints[relativeParetoWeightIndex],
numHouseholds,
sigma
)
}
}
valueFullRiskSharing <- calculateValueFullRiskSharing(
incomeTransitionMatrix,
aggregateIncomeGridPoints,
delta,
sigma,
autarkyValueMatrix,
consumptionOnRelativeParetoWeightGrid,
numRelativeParetoWeights,
numHouseholds
)
valueLCRiskSharing <- calculateValueLCRiskSharing(
valueFullRiskSharing,
consumptionOnRelativeParetoWeightGrid,
aggregateIncomeGridPoints,
incomeTransitionMatrix,
autarkyValueMatrix,
relativeParetoWeightsGridPoints,
numRelativeParetoWeights,
delta,
sigma,
numIncomeStates,
numHouseholds,
iterationLimit,
diffLimit
)
return(valueLCRiskSharing)
}solveLCRiskSharingByVillage <- function(
village,
delta,
sigma,
punishment,
householdAR1EstimationResult,
villageAR1EstimationResult,
numIncomeStates,
numRelativeParetoWeights = 2000,
iterationLimit = 100,
diffLimit = 1e-8
) {
numHouseholds <- householdAR1EstimationResult[[village]]$numHouseholds
relativeParetoWeightBoundsArray <- array(
NA,
c(2, 2, numIncomeStates, 2)
)
for (meanClass in seq(1, 2)) {
for (CVClass in seq(1, 2)) {
householdIncomeTransitionMatrix <- (
householdAR1EstimationResult[[village]]$transitionMatrixArray[meanClass, CVClass, ,]
)
householdIncomeGridPoints <- (
householdAR1EstimationResult[[village]]$gridPointsArray[meanClass, CVClass,]
)
villageIncomeTransitionMatrix <- (
villageAR1EstimationResult[[village]]$transitionMatrix
)
villageIncomeGridPoints <- (
villageAR1EstimationResult[[village]]$gridPoints
)
relativeParetoWeightBoundsArray[meanClass, CVClass, ,] <- solveLCRiskSharing(
delta,
sigma,
punishment,
householdIncomeTransitionMatrix,
householdIncomeGridPoints,
villageIncomeTransitionMatrix,
villageIncomeGridPoints,
numIncomeStates,
numHouseholds,
numRelativeParetoWeights,
iterationLimit,
diffLimit
)$relativeParetoWeightBounds
}
}
return(relativeParetoWeightBoundsArray)
}save.image("IntermediateData/lc_hom_model_functions.RData")3.2.7 Sanity test: replication of Figure 1 in Ligon, Thomas, and Worrall (2002)
For the sanity test of this function, I use it to replicate the Figure 1 in Ligon, Thomas, and Worrall (2002). Here I use the parameter values in the original paper. I choose the income process (y_l, y_h) = (2/3, 4/3) and (p_l, p_h) = (0.1, 0.9) for both households so that the mean is 1 and the ratio y_l / y_h is 1/2 as in the paper. Also, the penalty under autarky is absent as in the original numerical exercise. Finally, I assume the CRRA utility functions:
u(c_{it}) = \frac{c_{it}^{1 - \sigma} - 1}{1 - \sigma}.
sigmaLTW <- 1.0
punishmentLTW <- 0.0

incomeTransitionMatrixLTW <- matrix(rep(c(0.1, 0.9), 2), nrow = 2, byrow = TRUE)
incomeGridPointsLTW <- c(2/3, 4/3)
numIncomeStatesLTW <- length(incomeGridPointsLTW) *  length(incomeGridPointsLTW)
numHouseholdsLTW <- 2

deltaVec <- seq(0.8, 0.999, by = 0.002)
LCRiskSharingResultLTW <- map(
deltaVec,
~ solveLCRiskSharing(
.,
sigmaLTW,
punishmentLTW,
incomeTransitionMatrixLTW,
incomeGridPointsLTW,
incomeTransitionMatrixLTW,
incomeGridPointsLTW,
numIncomeStatesLTW,
numHouseholdsLTW,
numRelativeParetoWeights = 10000,
iterationLimit = 1000,
diffLimit = 1e-8
)
)createLCFigure <- function(
deltaVec,
incomeGridPoints,
relativeParetoWeightBoundsArray
) {
LCFigure <- ggplot() +
geom_line(aes(deltaVec, log(relativeParetoWeightBoundsArray[1,1,]), color = "a")) +
geom_line(aes(deltaVec, log(relativeParetoWeightBoundsArray[1,2,]), color = "b")) +
geom_line(aes(deltaVec, log(relativeParetoWeightBoundsArray[2,1,]), color = "c")) +
geom_line(aes(deltaVec, log(relativeParetoWeightBoundsArray[2,2,]), color = "d")) +
geom_line(aes(deltaVec, log(relativeParetoWeightBoundsArray[3,1,]), color = "e")) +
geom_line(aes(deltaVec, log(relativeParetoWeightBoundsArray[3,2,]), color = "f")) +
geom_line(aes(deltaVec, log(relativeParetoWeightBoundsArray[4,1,]), color = "g")) +
geom_line(aes(deltaVec, log(relativeParetoWeightBoundsArray[4,2,]), color = "h")) +
coord_cartesian(
xlim = c(0.8, 1.0),
ylim = c(
log(incomeGridPoints[1] / incomeGridPoints[2]),
log(incomeGridPoints[2] / incomeGridPoints[1])
)
) +
geom_ribbon(aes(x = deltaVec,
ymin = log(relativeParetoWeightBoundsArray[1,1,]),
ymax = log(relativeParetoWeightBoundsArray[1,2,])),
fill = "blue", alpha = 0.2) +
geom_ribbon(aes(x = deltaVec,
ymin = log(relativeParetoWeightBoundsArray[2,1,]),
ymax = log(relativeParetoWeightBoundsArray[2,2,])),
fill = "red", alpha = 0.2) +
geom_ribbon(aes(x = deltaVec,
ymin = log(relativeParetoWeightBoundsArray[3,1,]),
ymax = log(relativeParetoWeightBoundsArray[3,2,])),
fill = "green", alpha = 0.2) +
geom_ribbon(aes(x = deltaVec,
ymin = log(relativeParetoWeightBoundsArray[4,1,]),
ymax = log(relativeParetoWeightBoundsArray[4,2,])),
fill = "yellow", alpha = 0.2) +
scale_color_manual(
name = "End-points",
values = c(
"blue",
"purple",
"brown",
"red",
"yellow",
"green",
"orange",
"gray"
),
labels = unname(TeX(c(
"$\\underline{x}_{ll}$",
"$\\bar{x}_{ll}$",
"$\\underline{x}_{hl}$",
"$\\bar{x}_{hl}$",
"$\\underline{x}_{lh}$",
"$\\bar{x}_{lh}$",
"$\\underline{x}_{hh}$",
"$\\bar{x}_{hh}$"
)))
) +
xlab("Discount factor (delta)") +
ylab("log of the relative Pareto weights (x)") +
theme_classic()
return(LCFigure)
}relativeParetoWeightBoundsArrayLTW = array(
NA,
dim = c(numIncomeStatesLTW, 2, length(deltaVec))
)
for (deltaIndex in seq_along(deltaVec)) {
relativeParetoWeightBoundsArrayLTW[,,deltaIndex] <- (
LCRiskSharingResultLTW[[deltaIndex]]$relativeParetoWeightBounds
)
}
LCFigure <- createLCFigure(
deltaVec,
incomeGridPointsLTW,
relativeParetoWeightBoundsArrayLTW
)
LCFigure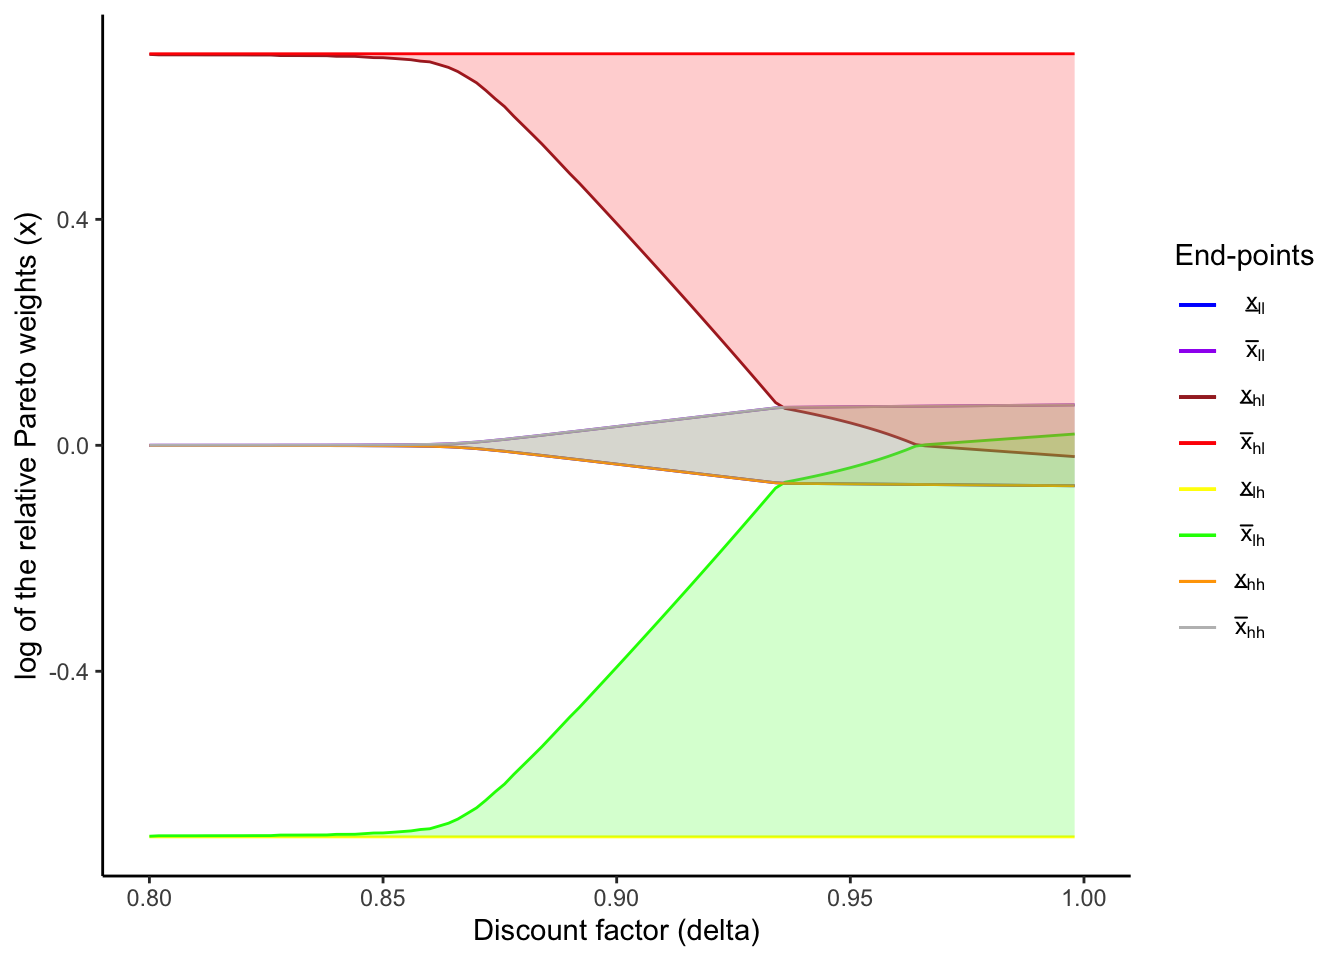
saveRDS(
  relativeParetoWeightBoundsArrayLTW,
  file.path('IntermediateData/relativeParetoWeightBoundsArrayLTW.rds')
)
saveRDS(
  createLCFigure,
  file.path('IntermediateData/createLCFigure.rds')
)
saveRDS(
  LCFigure,
  file.path('IntermediateData/LCFigure.rds')
)
3.3 References
Ligon, Ethan, Jonathan P. Thomas, and Tim Worrall. 2002. “Informal Insurance Arrangements with Limited Commitment: Theory and Evidence from Village Economies.” Review of Economic Studies 69 (1): 209–44. https://doi.org/10.1111/1467-937X.00204.
Marcet, Albert, and Ramon Marimon. 2019. “Recursive Contracts.” Econometrica 87 (5): 1589–1631.