pacman::p_load(
  tidyverse,
  kableExtra,
  latex2exp
)4 Comparison: Risk sharing with limited commitment but without storage
Finally, I compare the model with a risk-sharing model under limited commitment but without storage, as in Kocherlakota (1996) and Ligon, Thomas, and Worrall (2002). I use the simulation code I wrote on this webstie. After I show that, in contrast to the model with saving, the model here gives consumption whcih takes a finite number of values in limit, I demonstrate that the welfare actually can decrease due to the existence of storage.
4.1 Code
4.1.1 Utility functions
calculateUtility <- function(cons, sigma) {
  if (sigma != 1) {
    utility = (cons^(1 - sigma) - 1) / (1 - sigma)
  } else if (sigma == 1) {
    utility = log(cons)
  }
  return(utility)
}
calculateMarginalUtility <- function(cons, sigma) cons^(- sigma)
4.1.2 Consumption function
calculateHH1Consumption <- function(
  aggregateResources,
  relativeParetoWeight,
  sigma
) {
    aggregateResources / (1 + (relativeParetoWeight^(1 / sigma)))
}
4.1.3 Value under autarky
calculateAutarkyValue <- function(
    incomeGridPoints,
    sigma,
    delta,
    punishment,
    incomeTransitionMatrix
) {

  autarkyValue <- numeric(length = length(incomeGridPoints))
  i <- 1
  diff <- 1
  while (diff > 1e-12) {
    autarkyValueNew <- (
      calculateUtility(incomeGridPoints * (1 - punishment), sigma)
      + delta * incomeTransitionMatrix %*% autarkyValue
    )
    diff <- max(abs(autarkyValueNew - autarkyValue))
    autarkyValue <- autarkyValueNew
    i <- i + 1
  }
  return(autarkyValue)
}
getRelativeParetoWeightsGridPoints <- function(
sigma,
punishment,
householdIncomeGridPoints,
villageIncomeGridPoints,
numRelativeParetoWeights
) {
minRelativeParetoWeights <- (
calculateMarginalUtility(max(villageIncomeGridPoints), sigma)
/ calculateMarginalUtility(min(householdIncomeGridPoints * (1 - punishment)), sigma)
)
maxRelativeParetoWeights <- (
calculateMarginalUtility(min(villageIncomeGridPoints * (1 - punishment)), sigma)
/ calculateMarginalUtility(max(householdIncomeGridPoints), sigma)
)
relativeParetoWeightsGridPoints <- exp(
seq(
log(minRelativeParetoWeights),
log(maxRelativeParetoWeights),
length.out = numRelativeParetoWeights)
)
return(relativeParetoWeightsGridPoints)
}calculateHouseholdConsumption <- function(
aggregateIncome,
relativeParetoWeight,
numHouseholds,
sigma
) {
aggregateIncome / (1 + (numHouseholds - 1) * (relativeParetoWeight^(- 1 / sigma)))
}calculateValueFullRiskSharing <- function(
incomeTransitionMatrix,
aggregateIncomeGridPoints,
delta,
sigma,
autarkyValueMatrix,
consumptionOnRelativeParetoWeightGrid,
numRelativeParetoWeights,
numHouseholds
) {
# Initial guess is expected utilities under autarky
householdValueFullRiskSharing <- outer(
autarkyValueMatrix[, 1], rep(1, numRelativeParetoWeights)
)
villageValueFullRiskSharing <- outer(
autarkyValueMatrix[, 2], rep(1, numRelativeParetoWeights)
)
iteration <- 1
diff <- 1
while (diff > 1e-10 & iteration < 500) {
householdValueFullRiskSharingNew <- (
calculateUtility(consumptionOnRelativeParetoWeightGrid, sigma)
+ delta * incomeTransitionMatrix %*% householdValueFullRiskSharing
)
villageValueFullRiskSharingNew <- (
calculateUtility(
(aggregateIncomeGridPoints - consumptionOnRelativeParetoWeightGrid) / (numHouseholds - 1),
sigma
)
+ delta * incomeTransitionMatrix %*% villageValueFullRiskSharing
)
diff <- max(
max(abs(householdValueFullRiskSharing - householdValueFullRiskSharingNew)),
max(abs(villageValueFullRiskSharing - villageValueFullRiskSharingNew))
)
householdValueFullRiskSharing <- householdValueFullRiskSharingNew
villageValueFullRiskSharing <- villageValueFullRiskSharingNew
iteration <- iteration + 1
}
return(list(
householdValueFullRiskSharing = householdValueFullRiskSharing,
villageValueFullRiskSharing = villageValueFullRiskSharing
))
}interpolateValueFunction <- function(
relativeParetoWeight,
relativeParetoWeightsGridPoints,
valueFunctionMatrix
) {
apply(
valueFunctionMatrix,
1,
function(x) {
approx(
relativeParetoWeightsGridPoints,
x,
relativeParetoWeight,
rule = 2
)$y
}
)
}
calculateDiffLCRiskSharingAndAutarky <- function(
relativeParetoWeight,
relativeParetoWeightsGridPoints,
delta,
sigma,
aggregateIncome,
householdValueLCRiskSharing,
villageValueLCRiskSharing,
incomeTransitionProbVec,
householdAutarkyValue,
villageAutarkyValue,
numHouseholds
) {
householdConsumption <- calculateHouseholdConsumption(
aggregateIncome,
relativeParetoWeight,
numHouseholds,
sigma
)
householdValueLCRiskSharingAtRelativeParetoWeight <- interpolateValueFunction(
relativeParetoWeight,
relativeParetoWeightsGridPoints,
householdValueLCRiskSharing
)
villageValueLCRiskSharingAtRelativeParetoWeight <- interpolateValueFunction(
relativeParetoWeight,
relativeParetoWeightsGridPoints,
villageValueLCRiskSharing
)
householdDiffLCRiskSharingAndAutarky <- (
calculateUtility(householdConsumption, sigma)
+ delta * incomeTransitionProbVec %*% householdValueLCRiskSharingAtRelativeParetoWeight
- householdAutarkyValue
) %>% as.numeric
villageDiffLCRiskSharingAndAutarky <- (
calculateUtility((aggregateIncome - householdConsumption) / (numHouseholds - 1), sigma)
+ delta * incomeTransitionProbVec %*% villageValueLCRiskSharingAtRelativeParetoWeight
- villageAutarkyValue
) %>% as.numeric
return(list(
householdDiffLCRiskSharingAndAutarky = householdDiffLCRiskSharingAndAutarky,
villageDiffLCRiskSharingAndAutarky = villageDiffLCRiskSharingAndAutarky
))
}
calculateValueLCRiskSharing <- function(
valueFullRiskSharing,
consumptionOnRelativeParetoWeightGrid,
aggregateIncomeGridPoints,
incomeTransitionMatrix,
autarkyValueMatrix,
relativeParetoWeightsGridPoints,
numRelativeParetoWeights,
delta,
sigma,
numIncomeStates,
numHouseholds,
iterationLimit,
diffLimit
) {
# Initial guess is expected utilities under full risk sharing
householdValueLCRiskSharing <- valueFullRiskSharing$householdValueFullRiskSharing
villageValueLCRiskSharing <- valueFullRiskSharing$villageValueFullRiskSharing
diff <- 1
iteration <- 1
while ((diff > diffLimit) && (iteration <= iterationLimit)) {
# First, ignore enforceability and just update the value functions
# using the values at the previous iteration
householdValueLCRiskSharingNew <- (
calculateUtility(consumptionOnRelativeParetoWeightGrid, sigma)
+ delta * incomeTransitionMatrix %*% householdValueLCRiskSharing
)
villageValueLCRiskSharingNew <- (
calculateUtility(
(aggregateIncomeGridPoints - consumptionOnRelativeParetoWeightGrid) / (numHouseholds - 1),
sigma
)
+ delta * incomeTransitionMatrix %*% villageValueLCRiskSharing
)
# Now check enforceability at each state
for (incomeStateIndex in seq(1, numIncomeStates)) {
householdAutarkyValue <- autarkyValueMatrix[incomeStateIndex, 1]
villageAutarkyValue <- autarkyValueMatrix[incomeStateIndex, 2]
if (any(householdValueLCRiskSharingNew[incomeStateIndex, ] <= householdAutarkyValue)) {
villageValueLCRiskSharingNew[
incomeStateIndex,
householdValueLCRiskSharingNew[incomeStateIndex, ] <= householdAutarkyValue
] <- villageValueLCRiskSharingNew[
incomeStateIndex,
householdValueLCRiskSharingNew[incomeStateIndex, ] <= householdAutarkyValue
] %>% min
householdValueLCRiskSharingNew[
incomeStateIndex,
householdValueLCRiskSharingNew[incomeStateIndex, ] <= householdAutarkyValue
] <- householdAutarkyValue
}
if (any(villageValueLCRiskSharingNew[incomeStateIndex, ] <= villageAutarkyValue)) {
householdValueLCRiskSharingNew[
incomeStateIndex,
villageValueLCRiskSharingNew[incomeStateIndex, ] <= villageAutarkyValue
] <- householdValueLCRiskSharingNew[
incomeStateIndex,
villageValueLCRiskSharingNew[incomeStateIndex, ] <= villageAutarkyValue
] %>% min
villageValueLCRiskSharingNew[
incomeStateIndex,
villageValueLCRiskSharingNew[incomeStateIndex, ] <= villageAutarkyValue
] <- villageAutarkyValue
}
}
diff <- max(
max(abs(householdValueLCRiskSharingNew - householdValueLCRiskSharing)),
max(abs(villageValueLCRiskSharingNew - villageValueLCRiskSharing))
)
householdValueLCRiskSharing <- householdValueLCRiskSharingNew
villageValueLCRiskSharing <- villageValueLCRiskSharingNew
iteration <- iteration + 1
}
relativeParetoWeightBounds <- matrix(NA, nrow = numIncomeStates, ncol = 2)
for (incomeStateIndex in seq(1, numIncomeStates)) {
aggregateIncome <- aggregateIncomeGridPoints[incomeStateIndex]
incomeTransitionProbVec <- incomeTransitionMatrix[incomeStateIndex,]
householdAutarkyValue <- autarkyValueMatrix[incomeStateIndex, 1]
villageAutarkyValue <- autarkyValueMatrix[incomeStateIndex, 2]
if (
calculateDiffLCRiskSharingAndAutarky(
min(relativeParetoWeightsGridPoints),
relativeParetoWeightsGridPoints,
delta,
sigma,
aggregateIncome,
householdValueLCRiskSharing,
villageValueLCRiskSharing,
incomeTransitionProbVec,
householdAutarkyValue,
villageAutarkyValue,
numHouseholds
)$householdDiffLCRiskSharingAndAutarky < 0) {
relativeParetoWeightLowerBound <- uniroot(
function(x) {calculateDiffLCRiskSharingAndAutarky(
x,
relativeParetoWeightsGridPoints,
delta,
sigma,
aggregateIncome,
householdValueLCRiskSharing,
villageValueLCRiskSharing,
incomeTransitionProbVec,
householdAutarkyValue,
villageAutarkyValue,
numHouseholds
)$householdDiffLCRiskSharingAndAutarky},
c(min(relativeParetoWeightsGridPoints), max(relativeParetoWeightsGridPoints)),
tol = 1e-10,
maxiter = 300
)$root
} else {
relativeParetoWeightLowerBound <- min(relativeParetoWeightsGridPoints)
}
if (
calculateDiffLCRiskSharingAndAutarky(
max(relativeParetoWeightsGridPoints),
relativeParetoWeightsGridPoints,
delta,
sigma,
aggregateIncome,
householdValueLCRiskSharing,
villageValueLCRiskSharing,
incomeTransitionProbVec,
householdAutarkyValue,
villageAutarkyValue,
numHouseholds
)$villageDiffLCRiskSharingAndAutarky < 0) {
relativeParetoWeightUpperBound <- uniroot(
function(x) {calculateDiffLCRiskSharingAndAutarky(
x,
relativeParetoWeightsGridPoints,
delta,
sigma,
aggregateIncome,
householdValueLCRiskSharing,
villageValueLCRiskSharing,
incomeTransitionProbVec,
householdAutarkyValue,
villageAutarkyValue,
numHouseholds
)$villageDiffLCRiskSharingAndAutarky},
c(min(relativeParetoWeightsGridPoints), max(relativeParetoWeightsGridPoints)),
tol = 1e-10,
maxiter = 300
)$root
} else {
relativeParetoWeightUpperBound <- max(relativeParetoWeightsGridPoints)
}
relativeParetoWeightBounds[incomeStateIndex, 1] <- relativeParetoWeightLowerBound
relativeParetoWeightBounds[incomeStateIndex, 2] <- relativeParetoWeightUpperBound
}
if (iteration == iterationLimit) {
print("Reached the maximum limit of iterations!")
}
return(list(
householdValueLCRiskSharing = householdValueLCRiskSharing,
villageValueLCRiskSharing = villageValueLCRiskSharing,
relativeParetoWeightBounds = relativeParetoWeightBounds))
}solveLCRiskSharing <- function(
delta,
sigma,
punishment,
householdIncomeGridPoints,
villageIncomeGridPoints,
incomeTransitionMatrix,
incomeGridPointsMatrix,
numIncomeStates,
numHouseholds,
numRelativeParetoWeights = 2000,
iterationLimit = 100,
diffLimit = 1e-8
) {
aggregateIncomeGridPoints <- (
incomeGridPointsMatrix[, 1] + incomeGridPointsMatrix[, 2] * (numHouseholds - 1)
)
autarkyValueMatrix <- cbind(
calculateAutarkyValue(
householdIncomeGridPoints,
sigma,
delta,
punishment,
incomeTransitionMatrix
),
calculateAutarkyValue(
villageIncomeGridPoints,
sigma,
delta,
punishment,
incomeTransitionMatrix
)
)
relativeParetoWeightsGridPoints <- getRelativeParetoWeightsGridPoints(
sigma,
punishment,
householdIncomeGridPoints,
villageIncomeGridPoints,
numRelativeParetoWeights
)
consumptionOnRelativeParetoWeightGrid <- matrix(
NA, nrow = numIncomeStates, ncol = numRelativeParetoWeights
)
for (incomeStateIndex in seq_along(aggregateIncomeGridPoints)) {
for (relativeParetoWeightIndex in seq_along(relativeParetoWeightsGridPoints)) {
consumptionOnRelativeParetoWeightGrid[
incomeStateIndex,
relativeParetoWeightIndex
] <- calculateHouseholdConsumption(
aggregateIncomeGridPoints[incomeStateIndex],
relativeParetoWeightsGridPoints[relativeParetoWeightIndex],
numHouseholds,
sigma
)
}
}
valueFullRiskSharing <- calculateValueFullRiskSharing(
incomeTransitionMatrix,
aggregateIncomeGridPoints,
delta,
sigma,
autarkyValueMatrix,
consumptionOnRelativeParetoWeightGrid,
numRelativeParetoWeights,
numHouseholds
)
valueLCRiskSharing <- calculateValueLCRiskSharing(
valueFullRiskSharing,
consumptionOnRelativeParetoWeightGrid,
aggregateIncomeGridPoints,
incomeTransitionMatrix,
autarkyValueMatrix,
relativeParetoWeightsGridPoints,
numRelativeParetoWeights,
delta,
sigma,
numIncomeStates,
numHouseholds,
iterationLimit,
diffLimit
)
return(valueLCRiskSharing)
}sigma <- 1.0
punishment <- 0.0
delta <- 0.8
sigma <- 1
numHouseholds <- 2
numIncomeStates <- 3
incomeGridPointsHH1 <- c(0.353, 0.5, 0.647)
incomeGridPointsHH2 <- 1 - incomeGridPointsHH1
incomeGridPointsMatrix <- cbind(incomeGridPointsHH1, incomeGridPointsHH2)
aggregateIncomeGridPoints <- incomeGridPointsHH1 + incomeGridPointsHH2
incomeTransitionMatrix <- matrix(1 / 3, nrow = 3, ncol = 3)LCRiskSharingNoStorageResult <- solveLCRiskSharing(
delta,
sigma,
punishment,
incomeGridPointsHH1,
incomeGridPointsHH2,
incomeTransitionMatrix,
incomeGridPointsMatrix,
numIncomeStates,
numHouseholds,
numRelativeParetoWeights = 10000,
iterationLimit = 1000,
diffLimit = 1e-8
)set.seed(123)
simSize <- 5000
incomeSeq <- sample(seq(1, numIncomeStates), size = simSize, replace = TRUE)
relativeParetoWeightSeqNoStorage <- c(1)
consHH1SeqNoStorage <- c()
for (i in seq(1, simSize)) {
relativeParetoWeightSeqNoStorage <- c(
relativeParetoWeightSeqNoStorage,
relativeParetoWeightSeqNoStorage[i] %>%
pmax(
LCRiskSharingNoStorageResult$relativeParetoWeightBounds[
incomeSeq[i],
1
]
) %>%
pmin(
LCRiskSharingNoStorageResult$relativeParetoWeightBounds[
incomeSeq[i],
2
]
)
)
consHH1SeqNoStorage <- c(
consHH1SeqNoStorage,
calculateHH1Consumption(
(aggregateIncomeGridPoints[incomeSeq[i]]),
relativeParetoWeightSeqNoStorage[i + 1],
sigma
)
)
}
simulationResultNoStorage <- tibble(
period = seq(1, simSize),
income = incomeSeq,
consHH1 = consHH1SeqNoStorage
) %>%
mutate(
previousIncome = lag(income),
changeIncome = paste(as.character(previousIncome), '->', as.character(income))
)4.2 Simulation result
The figure shows the consumption evolution over time. Unlike the model with storage, the model without storage results in a consumption pattern which takes only a finite number of values in the steady state.
simulationResultNoStorage %>%
  filter(period >= 100) %>%
  ggplot() +
  geom_point(aes(x = period, y = consHH1), size = 0.3) +
  xlab('Time period') +
  ylab('HH1 consumption') +
  theme_classic()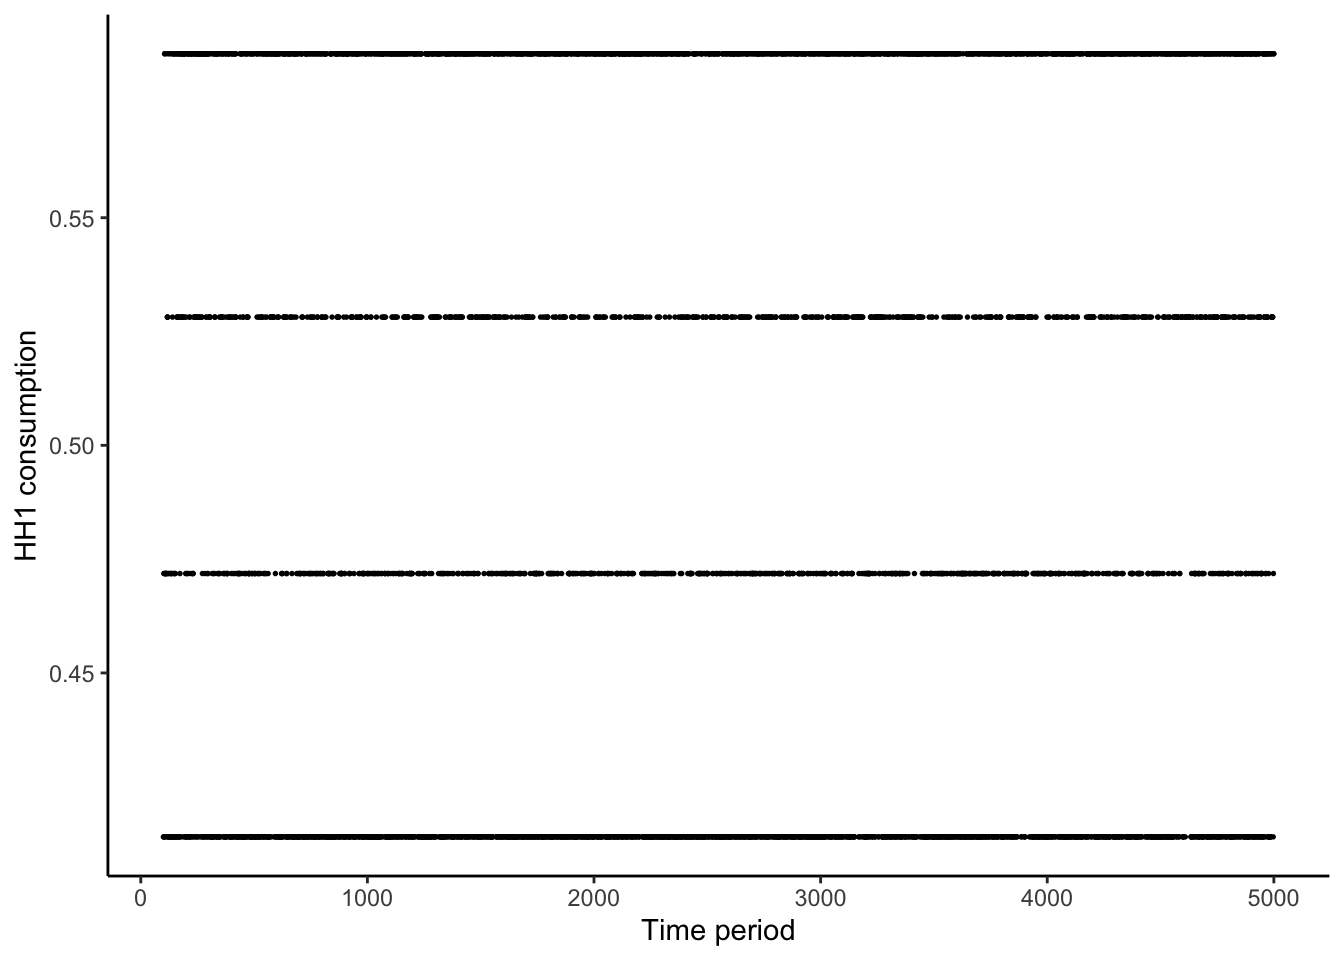
4.3 Comparison with the case with storage
The table below compares the consumption means, standard deviations, and the average utilities over time. Due to the storage with positive return on saving, the mean consumption is higher in the model with storage. However, due to the existence of storage, the autarky values are higher, and hence the risk-sharing functionality is degraded. This results in more variable consumption (second row) and hence, lower welfare (third row) in the model with storage. Notice that, this kind of reduced welfare is achieved only for medium-level returns on saving. If the return is too low, saving is not used and there is no welfare impact, and if the return is sufficiently high, the benefit from intertemporal consumption smoothing dominates and hence there is a welfare improvement.
simulationResult <- readRDS(
  file.path('IntermediateData/simulationResult.rds')
)
summaryTable <- cbind(
c(
(simulationResult %>% filter(period >= 100) %>% .$consHH1) %>% mean,
(simulationResult %>% filter(period >= 100) %>% .$consHH1) %>% sd,
log(simulationResult %>% filter(period >= 100) %>% .$consHH1) %>% mean
),
c(
(simulationResultNoStorage %>% filter(period >= 100) %>% .$consHH1) %>% mean,
(simulationResultNoStorage %>% filter(period >= 100) %>% .$consHH1) %>% sd,
log(simulationResultNoStorage %>% filter(period >= 100) %>% .$consHH1) %>% mean
)
)
rownames(summaryTable) <- c("Mean Cons.", "SD Cons", "Mean Util.")
colnames(summaryTable) <- c("With storage", "Without storage")
summaryTable %>%
kbl(digits = 4) %>%
kable_classic()| With storage | Without storage | |
|---|---|---|
| Mean Cons. | 0.5009 | 0.4992 |
| SD Cons | 0.0863 | 0.0717 |
| Mean Util. | -0.7067 | -0.7053 |
4.4 References
Kocherlakota, N. R. 1996. “Implications of Efficient Risk Sharing without Commitment.” The Review of Economic Studies 63 (4): 595–609. https://doi.org/10.2307/2297795.
Ligon, Ethan, Jonathan P. Thomas, and Tim Worrall. 2002. “Informal Insurance Arrangements with Limited Commitment: Theory and Evidence from Village Economies.” Review of Economic Studies 69 (1): 209–44. https://doi.org/10.1111/1467-937X.00204.